
In this post I am giving a quick overview of how to create editable plots in PowerPoint from R. These plots are comprised of simple vector-based shapes and thus allow you to change labels, colours, or text position in seconds. Your project managers will love it!
Motivation
R allows us to create great visualisations, but in most data science settings these need to be presented to key stakeholders and decision makers in presentations or “slideuments”. Having to make small changes to previously compiled slots can be time consuming and frustrating. A solution to this common problem is to keep your plots and graphs editable as a group of vector shapes in PowerPoint. This way project managers or data scientists themselves can make small changes without having to re-execute a single line of code.
Solution
We will use a tidyverse approach for creating the plot. Furthermore, the
officer package enables us to smoothly interact with PowerPoint, and the rvg
package is required to save our plots as editable vector graphs.
library(tidyverse)
library(officer)
library(rvg)
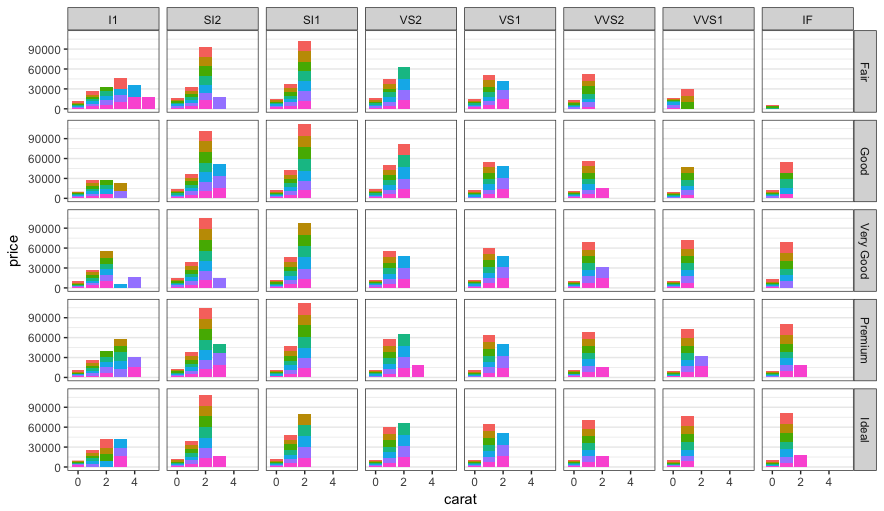
For demonstration purposes, let’s create a plot using the diamonds dataset.
NB: I am saving the ggplot object to a variable name, but also displaying the
plot when executing the lines by appending the ; ggp at the end.
# Using diamonds dataset which is shipped with R
ggp <- diamonds %>%
  # Let's simplify things by only considering natural number carats
  mutate(carat = floor(carat)) %>%
  group_by(carat, cut, clarity, color) %>%
  summarise(price = mean(price)) %>%
  # Create a plot of price by carat, colour, cut, and clarity
  ggplot(aes(x = carat, y = price, fill = color)) +
  geom_bar(stat = 'identity') +
  facet_grid(cut ~ clarity) +
  # Simplify the plot layout a little
  theme_bw() +
  guides(fill = FALSE) +
  theme(panel.grid.major.x = element_blank(),
        panel.grid.minor.x = element_blank()); ggp
Now we can use officer to create a new PowerPoint document and
rvg::ph_with_vg to drop our ggplot object in there.
# Create a new powerpoint document
doc <- read_pptx()
doc <- add_slide(doc, 'Title and Content', 'Office Theme')

# Add the plot
doc <- ph_with_vg(doc, ggobj = ggp, type = 'body')

# Write the document to a file
print(doc, target = 'plot.pptx')
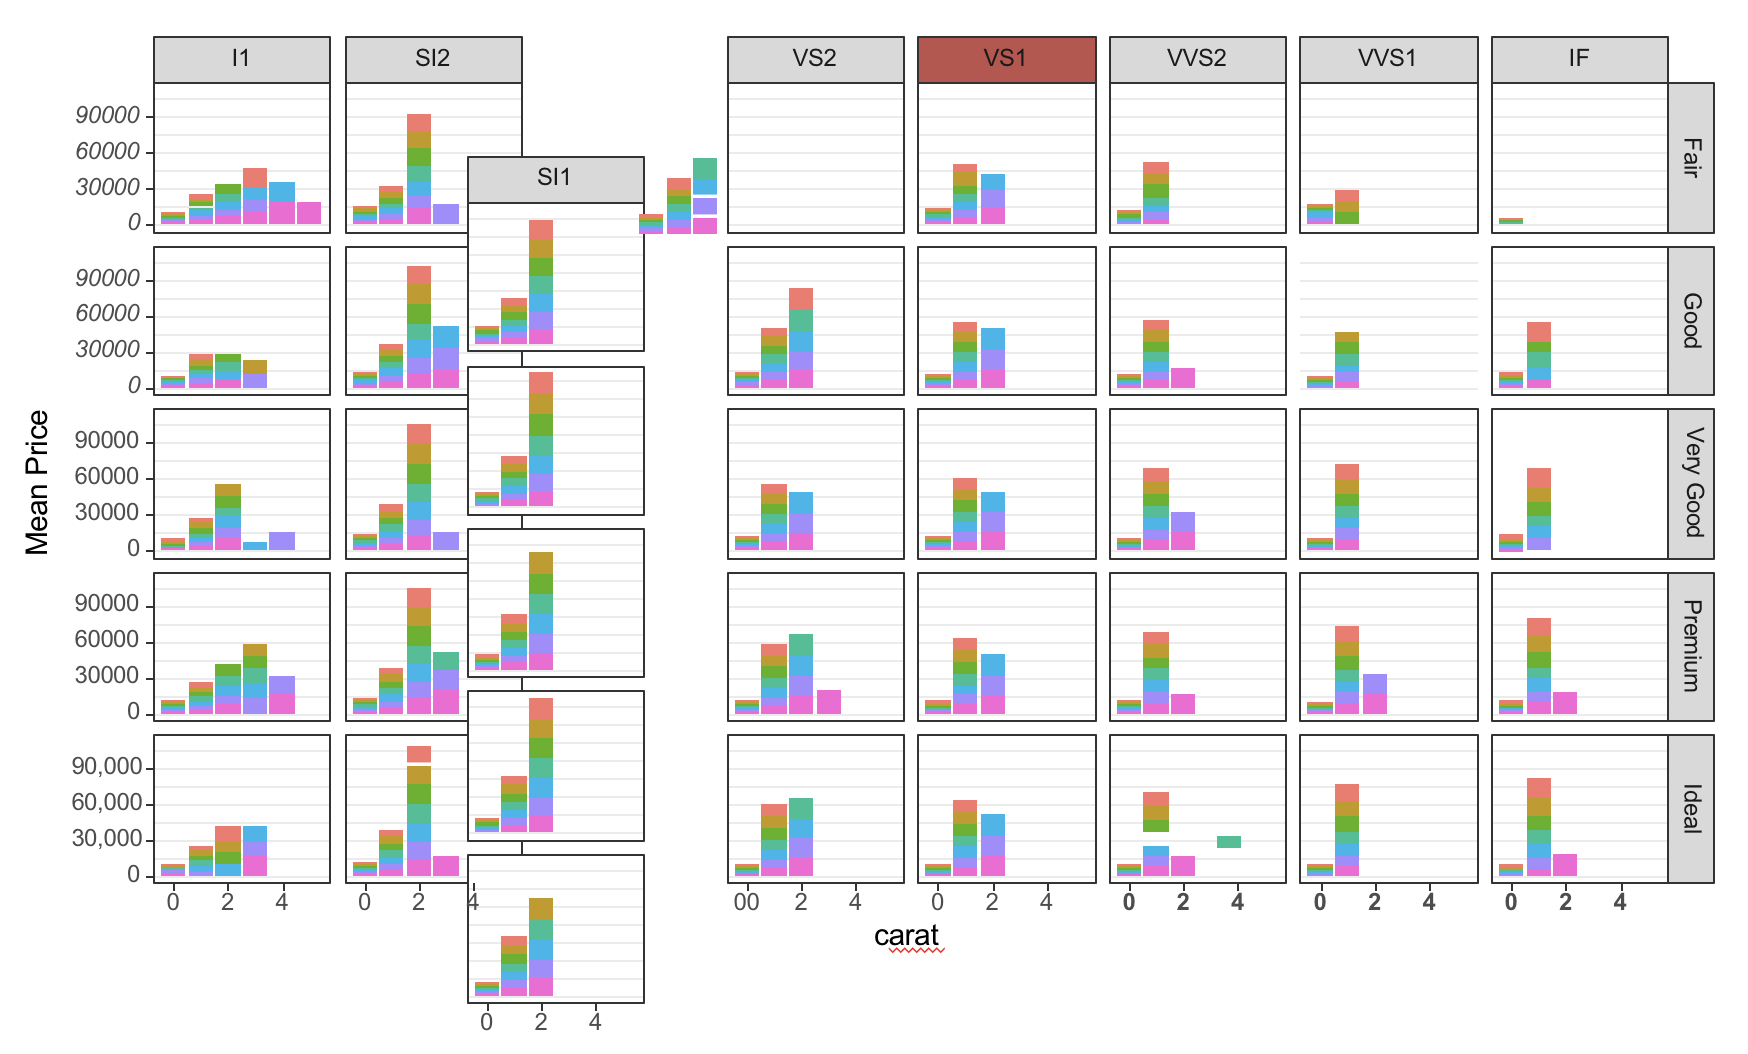
Now open the document in PowerPoint. Right-click and ungroup the plot. Voila! You should be able to select individual elements, for example the data bars in the plot, change their colour, move them around, change the text in labels, and much more. Have a look at the plot below. A cookie for you if you can find all ten edits that I made in the example.
As always, hope this is helpful. And FYI, I am still looking for a way to
achieve the same result using Python. If you know one, collect some bounty
here